tidy tuesday
data project in R
This page contains my contribution to the TidyTuesday challenge. This challenge is intended for people to practice data wrangling and data visualization skills using the R ecosystem. A new dataset is posted every Tuesday for the community to explore/ quantify/ manipulate and use to make meaningful visualizations.
All figures on this page were created purely in R (no involvement of other software/ tools). Code for each plot can be found on my GitHub page.
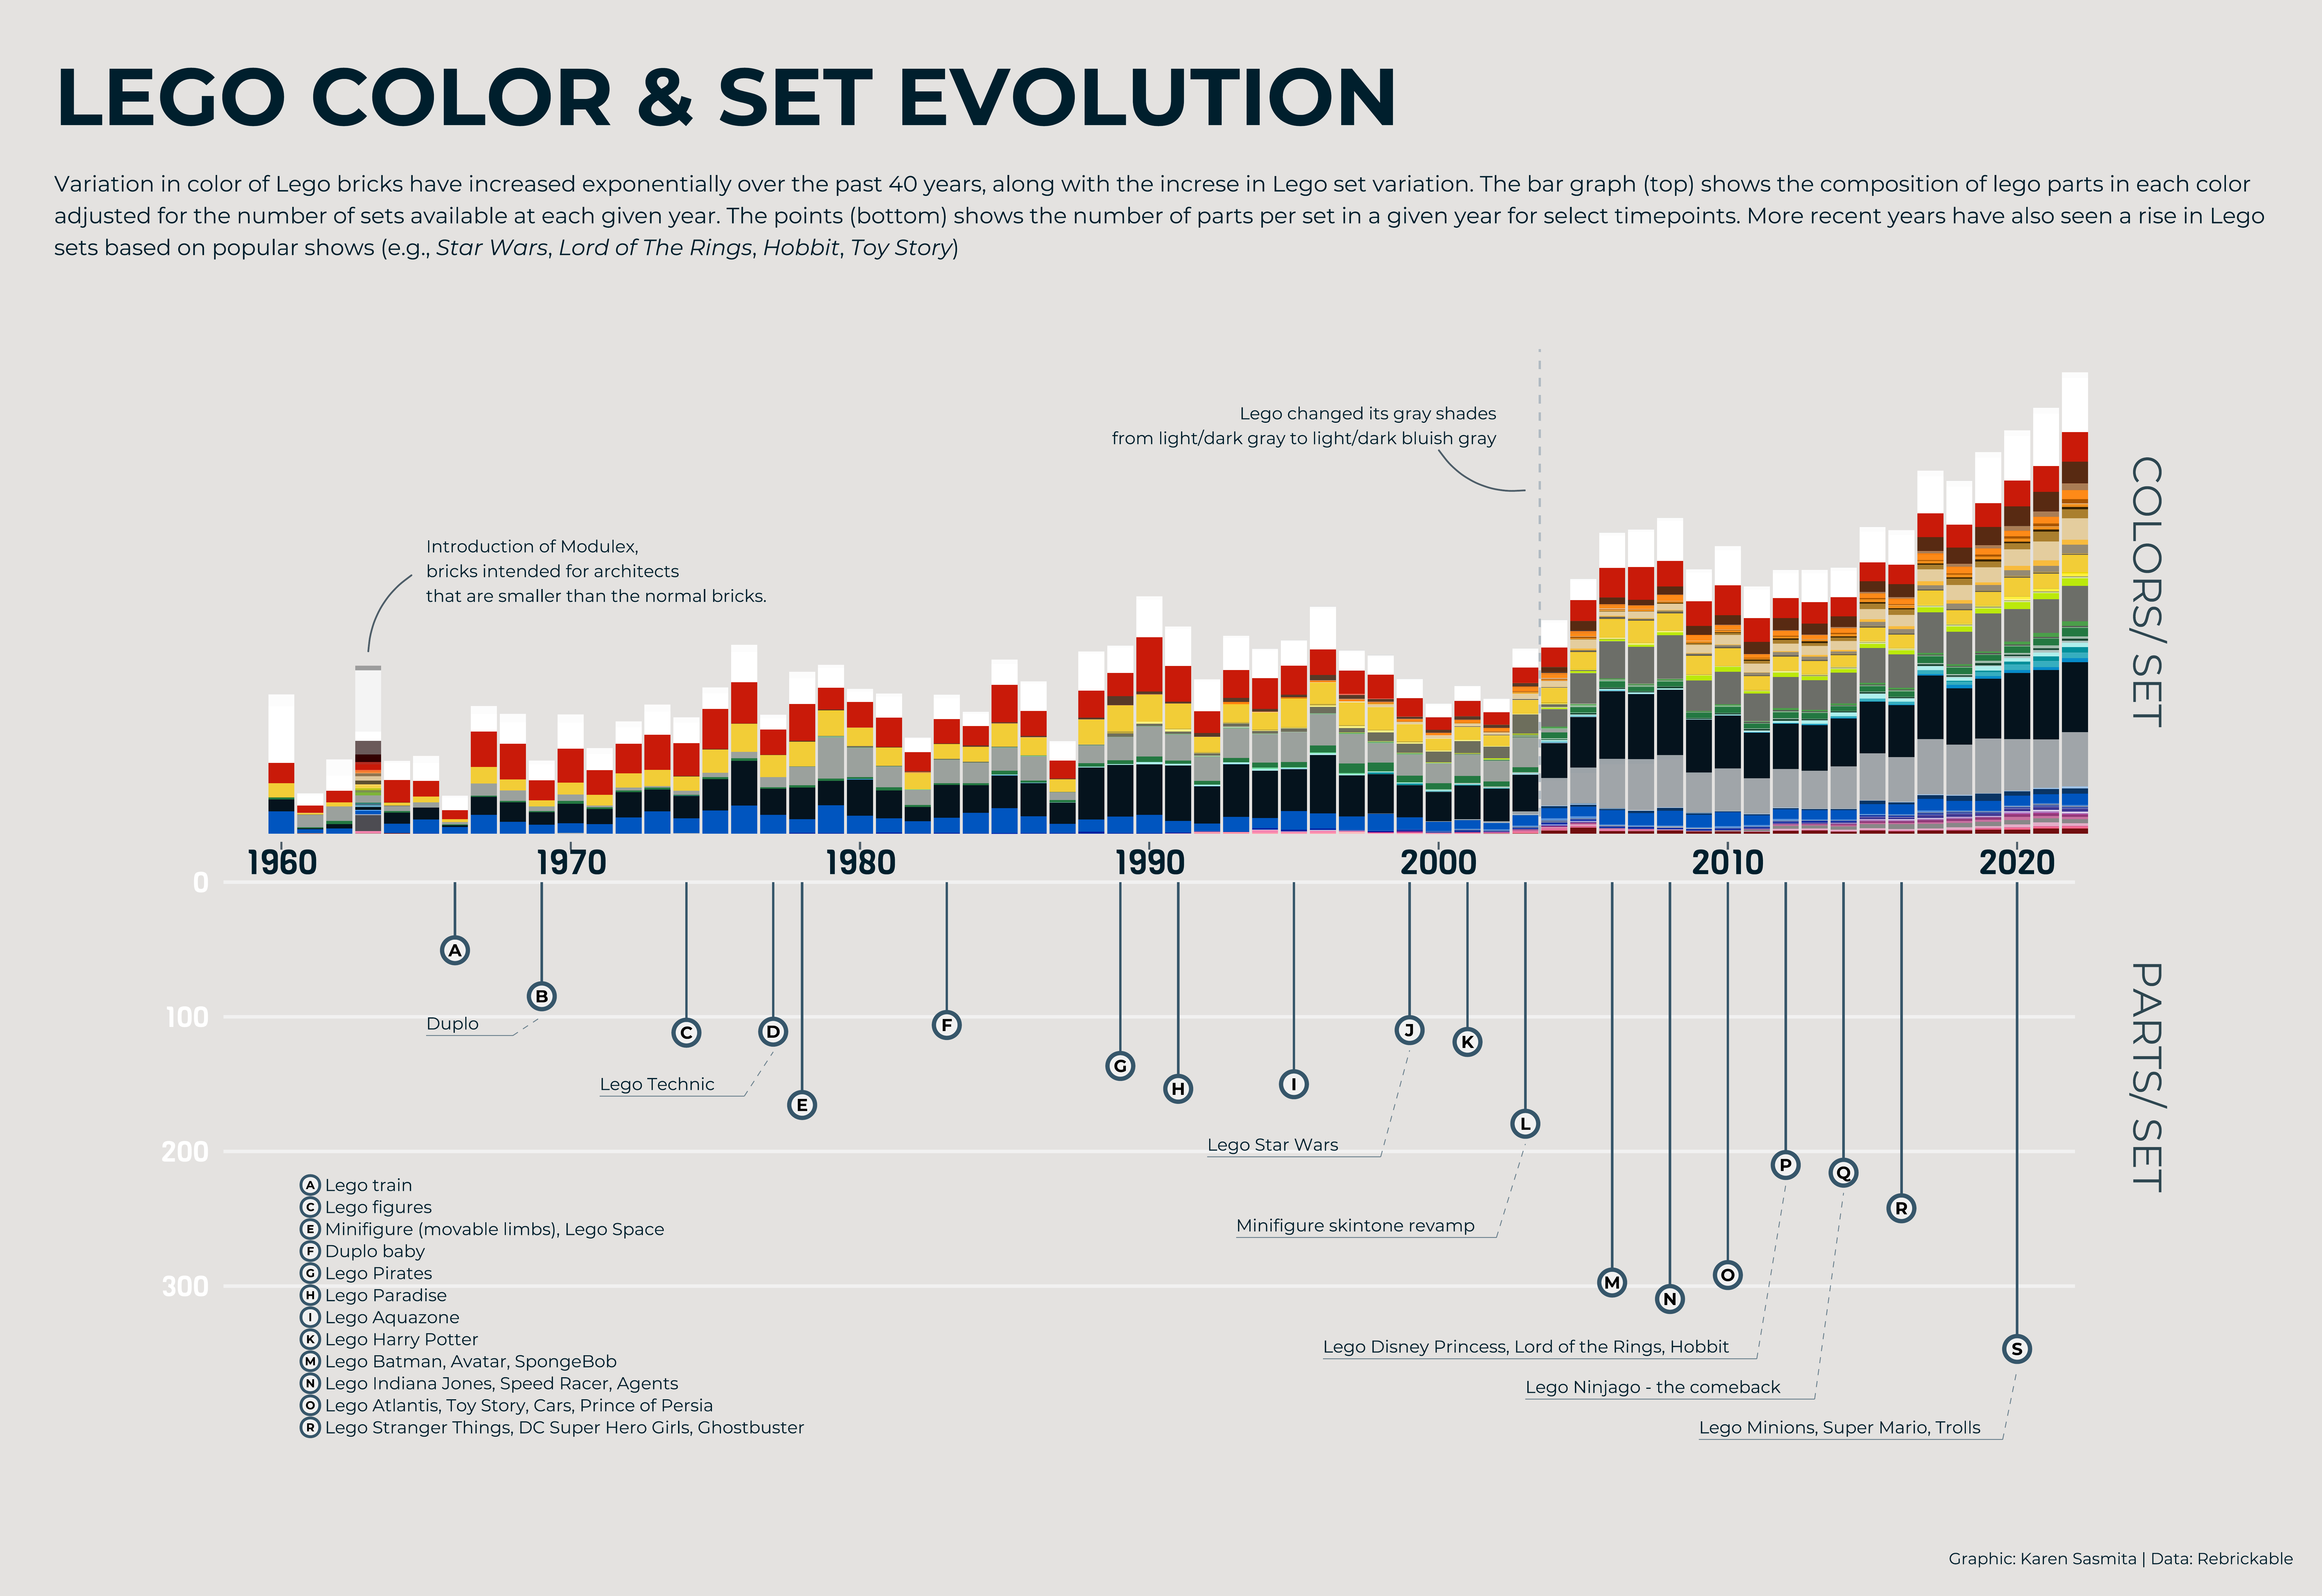
(2022/09/06) Rebrickable dataset |[code]
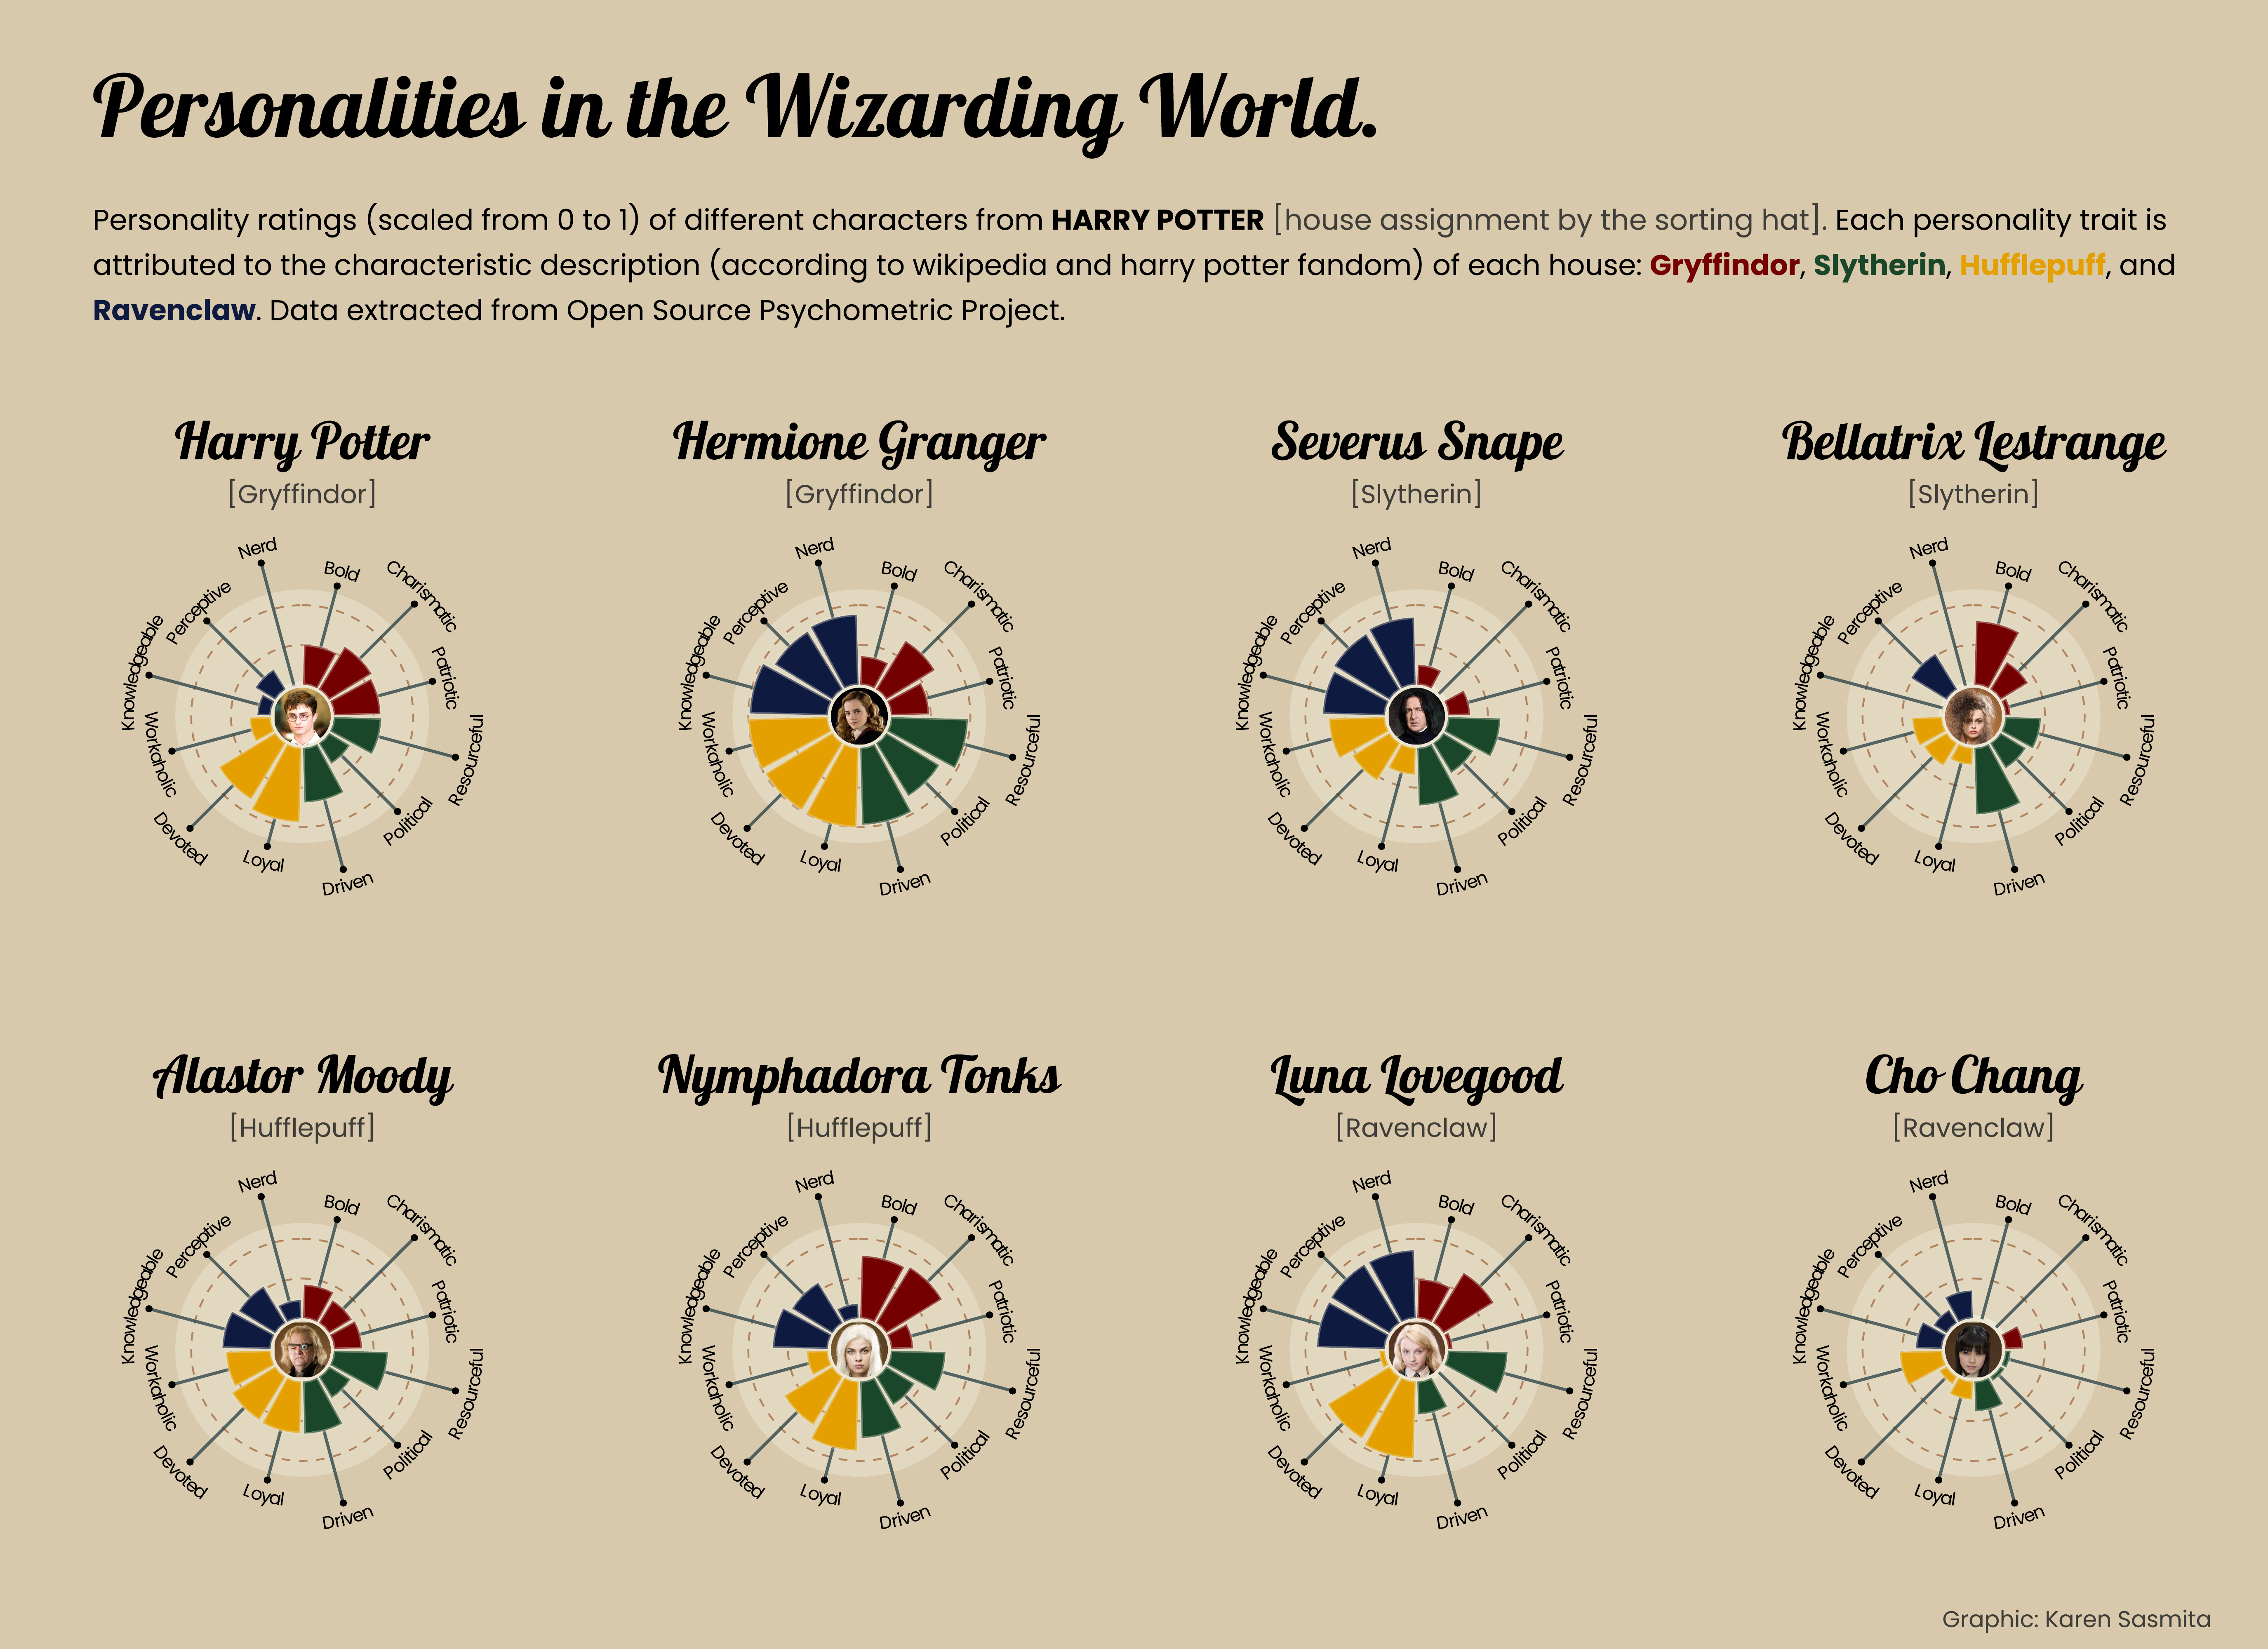
(2022/08/16) Open-Source Psychometrics Project dataset | [code]